
New capital expenditure
- Posted By Tod Anderson
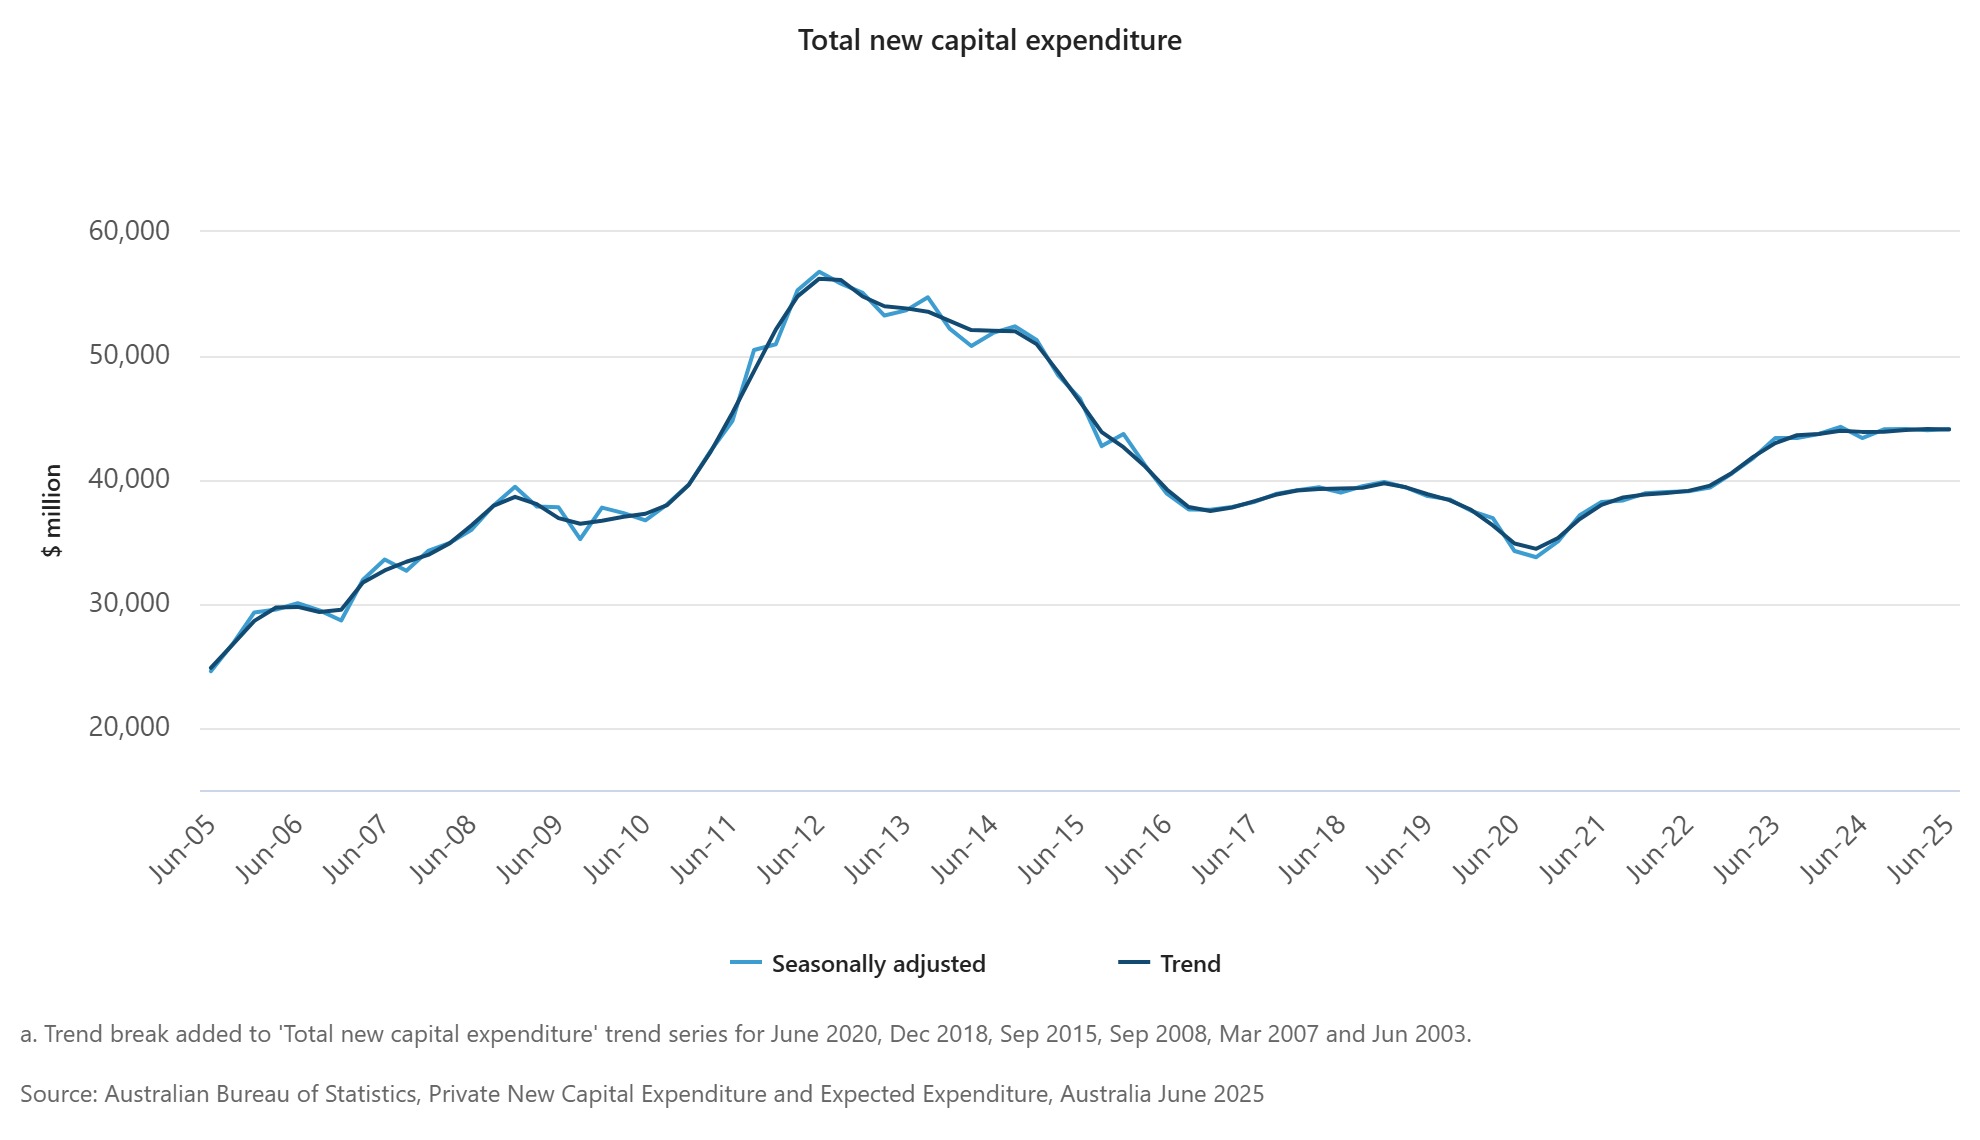
Data for “Private New Capital Expenditure and Expected Expenditure, Australia” has been released by the Australian Bureau of Statistics.
Figures indicate a 1.7% increase (seasonally adjusted) in total “new capital expenditure” (June QTR 24 to Jun QTR 25).
The “buildings and structures” component increased 4.3% (seasonally adjusted) for the same period.
A decline of 1.1% (seasonally adjusted) for the year to June QTR 25 was experienced in the “equipment, plant and machinery” component.
| Private New Capital Expenditure and Expected Expenditure, Australia | ||||
| Basis | Item | Jun Qtr 25 | Mar Qtr 25 to Jun Qtr 25 | Jun Qtr 24 to Jun Qtr 25 |
| ($m) | (% change) | (% change) | ||
| Seasonally adjusted(a) | Total new capital expenditure | 44,120 | 0.2 | 1.7 |
| Buildings and structures | 23,744 | 0.2 | 4.3 | |
| Equipment, plant and machinery | 20,376 | 0.3 | -1.1 | |
| Trend(a) | Total new capital expenditure | 44,080 | -0.1 | 0.5 |
| Buildings and structures | 23,770 | 0.5 | 2.7 | |
| Equipment, plant and machinery | 20,300 | -0.8 | -2.1 | |
a. In volume terms
Source: Australian Bureau of Statistics, Private New Capital Expenditure and Expected Expenditure, Australia June 2025