
Australian business entries and exits
- Posted By Tod Anderson
The Australian Bureau of Statistics has recently released its latest “Counts of Australian Businesses, including Entries and Exits” data.
Figures for the 2024-2025 period show a net increase of 66,650 businesses across Australia.
The increase in New South Wales was 20,040 being the largest net increase in any state or territory.
|
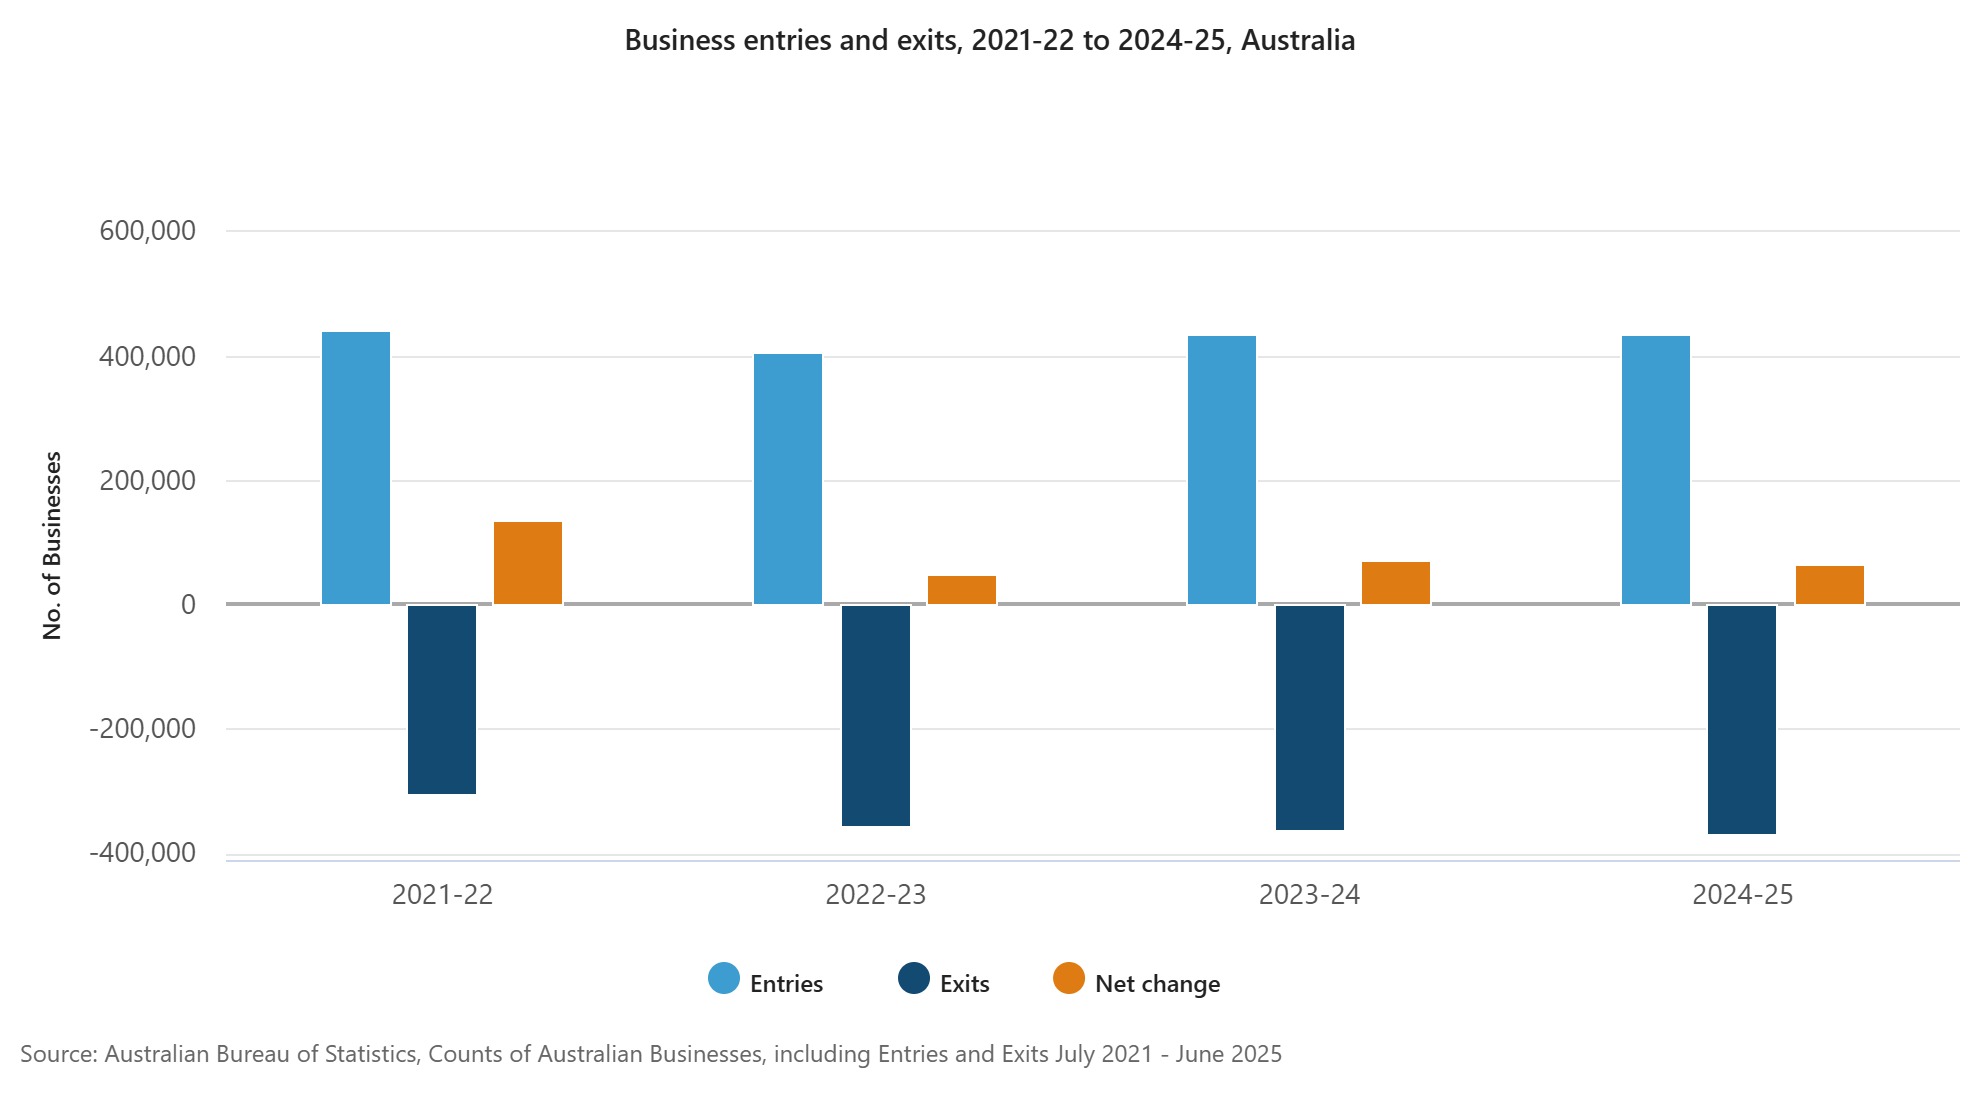
Business entries and exits, 2021-22 to 2024-25, Australia |
|||
|
Period |
Entries |
Exits |
Net change |
|
2021-22 |
442,555 |
-305,085 |
137,470 |
|
2022-23 |
406,365 |
-356,216 |
50,149 |
|
2023-24 |
436,018 |
-362,893 |
73,125 |
|
2024-25 |
437,150 |
-370,500 |
66,650 |
Source: Australian Bureau of Statistics, Counts of Australian Businesses, including Entries and Exits July 2021 - June 2025
The latest annual figures indicate the sectors with the largest percentage increase in businesses were:
- Health Care and Social Assistance
- Transport, Postal and Warehousing
- Financial and Insurance Services
With declines in the retail trade sector as well as in the agriculture, forestry and fishing sector.
|
Annual percent change in businesses by industry division, 2024-25 |
|
|
Sector |
Annual percent change |
|
Agriculture, Forestry and Fishing |
-0.8 |
|
Mining |
0.9 |
|
Manufacturing |
0.2 |
|
Electricity, Gas, Water and Waste Services |
1.0 |
|
Construction |
2.2 |
|
Wholesale Trade |
0.1 |
|
Retail Trade |
-0.4 |
|
Accommodation and Food Services |
1.2 |
|
Transport, Postal and Warehousing |
5.1 |
|
Information Media and Telecommunications |
1.5 |
|
Financial and Insurance Services |
3.7 |
|
Rental, Hiring and Real Estate Services |
3.1 |
|
Professional, Scientific and Technical Services |
2.5 |
|
Administrative and Support Services |
2.6 |
|
Public Administration and Safety |
1.8 |
|
Education and Training |
2.4 |
|
Health Care and Social Assistance |
6.6 |
|
Arts and Recreation Services |
2.3 |
|
Other Services |
2.7 |
Source: Australian Bureau of Statistics, Counts of Australian Businesses, including Entries and Exits July 2021 - June 2025